Recently, the NFL hosted the first ever “Big Data Bowl” which challenged anybody to help create insights from their player tracking data. The data provided included 91 games from the first 6 weeks of the 2017 NFL season. Although I was too late to submit a paper, I was able to download the data and I thought it would make a great topic for my first real blog post. Specifically, I wanted to focus on finding the best receiver/route combinations, one of the themes suggested by the NFL. However, I also chose to focus my analysis on my favorite team: the LA Chargers.
The first step in the process was to define what a route is. Here, I focused on the movement of the receiver from the time the ball was snapped to the time the ball arrives at the receiver. The animation below shows the route defined for a 50 yard catch by Keenan Allen against the Eagles (notice this does not show his 35 yards after the catch).
By looking at the shape of the route highlighted in red, we can tell this is a simple in/dig route, where the receiver cuts in towards the middle of the field after about 10-15 yards. We could potentially go through each of these routes and name them, but that would be very time consuming since there were over 650 routes by Chargers receivers and tight ends during these 6 games alone (note: this excludes routes by running backs). That’s where clustering comes in.
This was not a straightforward clustering problem by any means. The first problem was standardizing the position on the field for each receiver. Since we’d like to classify routes based on whether the receiver is going towards the sideline or the middle of the field, this took some logic based on where the receiver was positioned at the start of the play. Here’s what all the routes looked like after standardizing this way.
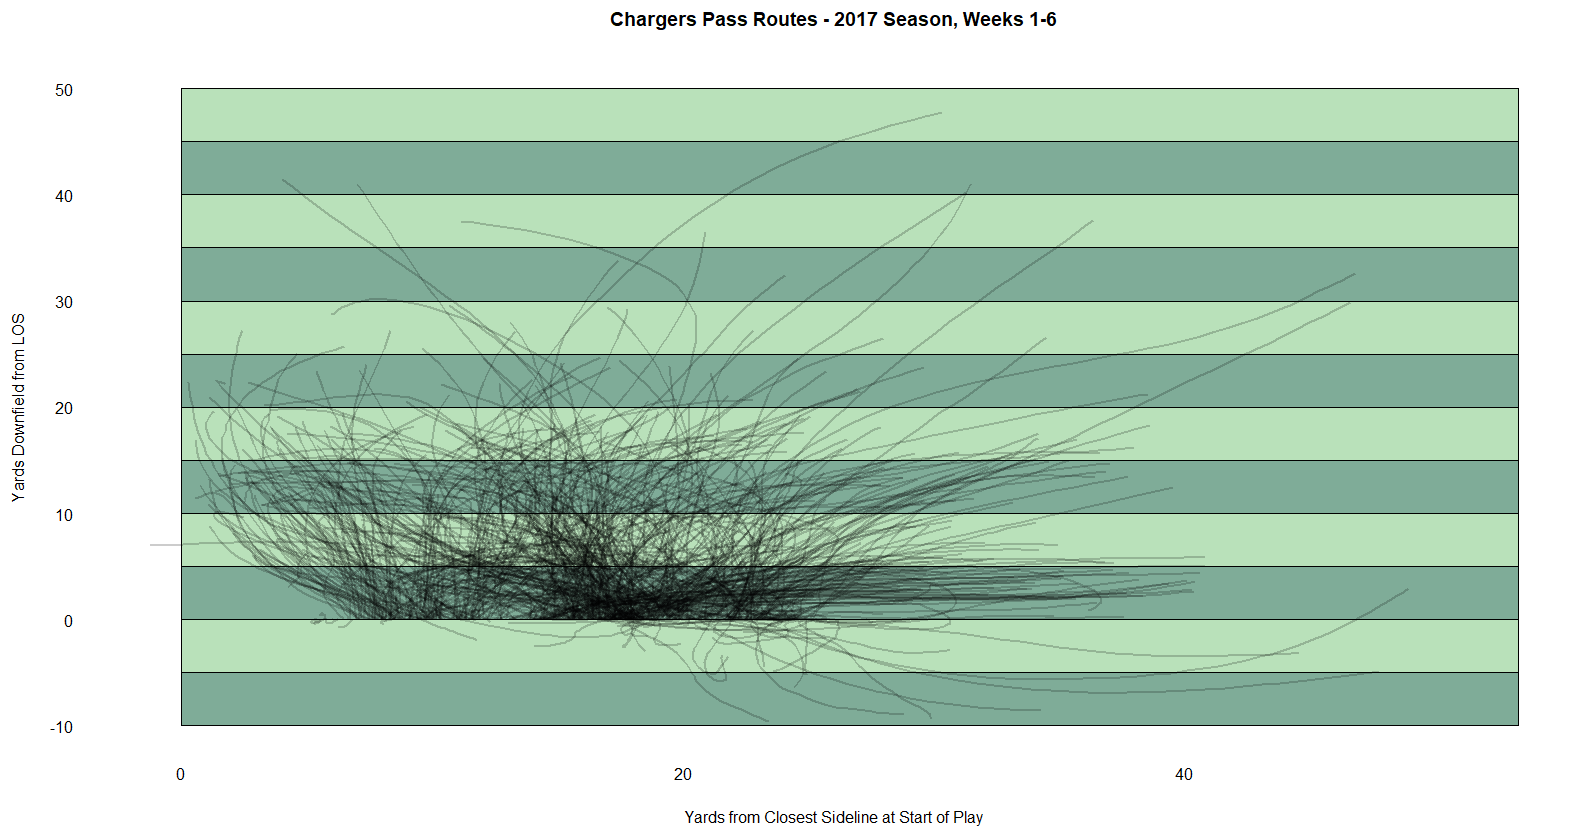
While this looks like a big mess of spaghetti, it’s getting somewhere. Now, the next problem is that each route is a time series of coordinates that have different lengths (i.e. some routes may take 5 seconds, others may take 10). Some quick research helped me find something called “Dynamic Time Warping” (DTW), which has a pretty cool name and is supposed to help map multiple time axes into one. So I tried the dtwclust package in R, which does clustering of time series after applying DTW. After messing around with the number of clusters/types of routes to define, I finally settled on 15. Here’s what the chart above looks like for each of the 15 groups of routes.
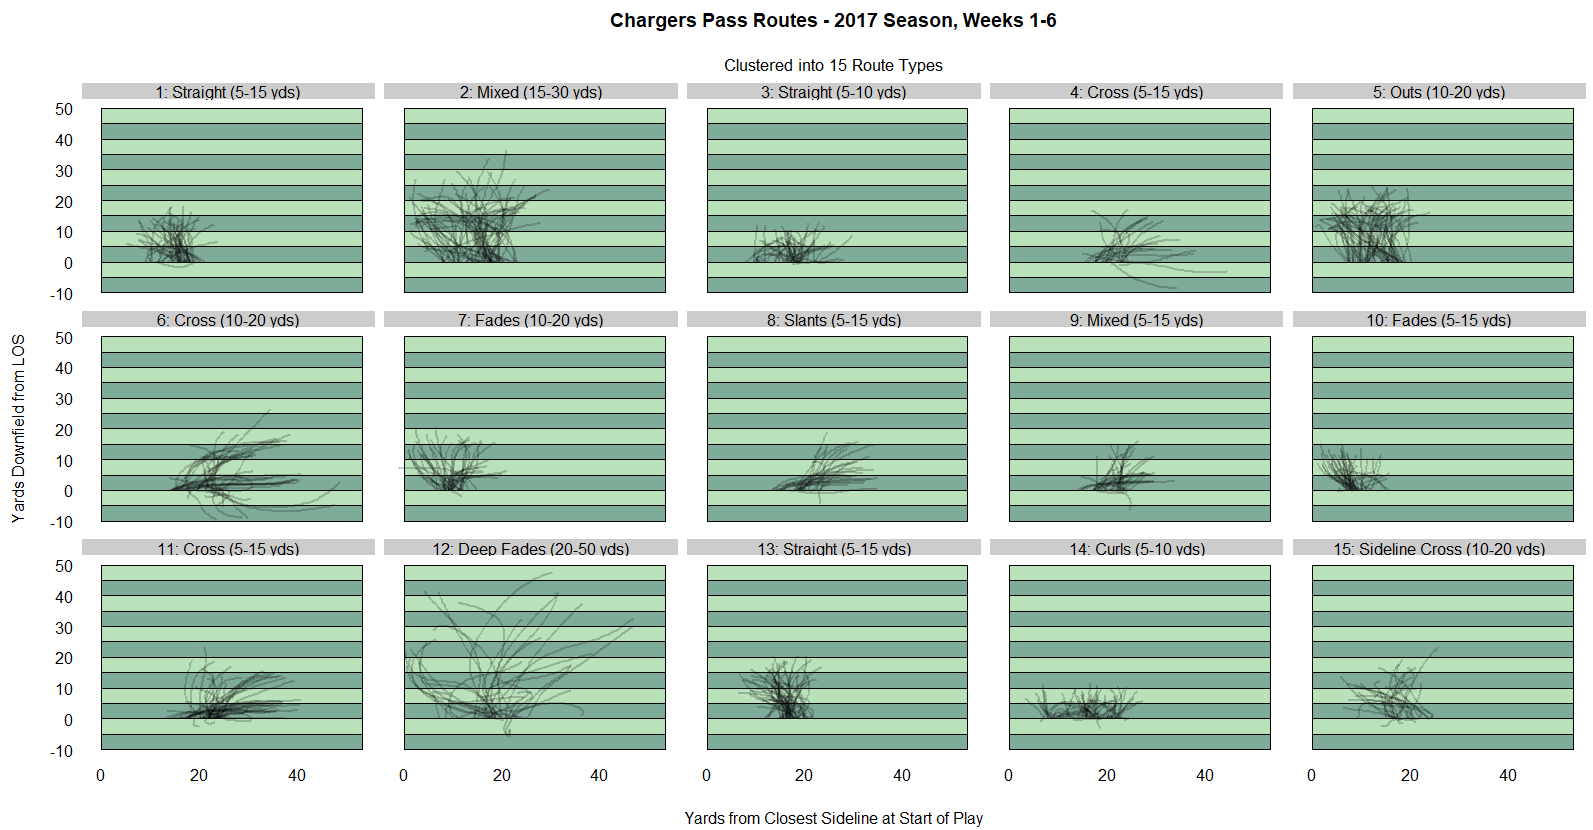
As you can see in the plot, I attempted to name the 15 route types into names like “fade”, “cross”, or “slant”, but a lot of them were mixed bags. It’s okay for now – it’s not a perfect model (because “all models are wrong”), but it may still be useful for these purposes.
From here, we just need to quantify what the “best” routes were. Let’s see what the top 15 receiver/route combinations are by success rates when targeted (targets are inferred by the closest receiver to the ball when the data indicates that the pass “arrived”).
| Rank | Route | Receiver | Number of Routes | Number of Targets | Success Rate | Avg. Yards | Target Rate | Completion Pct. |
|---|---|---|---|---|---|---|---|---|
| 1 | 11: Cross (5-15 yds) | Keenan Allen | 11 | 3 | 91% | 20 | 27% | 100% |
| 2 | 1: Straight (5-15 yds) | Keenan Allen | 13 | 5 | 85% | 7 | 39% | 80% |
| 3 | 2: Mixed (15-30 yds) | Hunter Henry | 10 | 5 | 80% | 17.8 | 50% | 80% |
| 4 | 10: Fades (5-15 yds) | Keenan Allen | 6 | 4 | 83% | 5.75 | 67% | 75% |
| 5 | 2: Mixed (15-30 yds) | Keenan Allen | 18 | 8 | 78% | 17.6 | 44% | 75% |
| 6 | 2: Mixed (15-30 yds) | Travis Benjamin | 15 | 4 | 67% | 9.25 | 27% | 75% |
| 7 | 11: Cross (5-15 yds) | Hunter Henry | 7 | 3 | 86% | 8.33 | 43% | 67% |
| 8 | 13: Straight (5-15 yds) | Hunter Henry | 11 | 3 | 64% | 6.67 | 27% | 67% |
| 9 | 2: Mixed (15-30 yds) | Tyrell Williams | 17 | 3 | 77% | 8.33 | 18% | 67% |
| 10 | 15: Sideline Cross (10-20 yds) | Antonio Gates | 11 | 4 | 36% | 7 | 36% | 50% |
| 11 | 3: Straight (5-10 yds) | Keenan Allen | 14 | 4 | 86% | 4.75 | 29% | 50% |
| 12 | 5: Outs (10-20 yds) | Tyrell Williams | 16 | 4 | 69% | 6 | 25% | 50% |
| 13 | 12: Deep Fades (20-50 yds) | Travis Benjamin | 7 | 5 | 43% | 12.8 | 71% | 40% |
| 14 | 14: Curls (5-10 yds) | Keenan Allen | 17 | 3 | 82% | 2.33 | 18% | 33% |
| 15 | 14: Curls (5-10 yds) | Tyrell Williams | 17 | 3 | 88% | 4.67 | 18% | 33% |
- Notes:
- Route/Receiver combinations with fewer than 3 targets excluded.
- Success rate is defined as the percent of plays (regardless of who is targeted) that gain: >= 33% of yards to gain on 1st down, >= 50% of yards to gain on 2nd down, and 100% of yards to gain on 3rd and 4th down.
Keenan Allen, the Chargers #1 receiver and Pro-Bowler, has his fair share of the top routes in terms of completion % when targeted - taking 4 out of the top 5. However, this table suggests that he may not be targeted as often as he should be. Although he ran a lot of crossing routes, he was only targeted 27% of the time. Meanwhile, Travis Benjamin was targeted on 5 out of 7 of his deep fade routes – a boom or bust play that only pays off about 40% of the time (and we have seen some recent examples of when it doesn’t pay off). If I’m the Chargers, I let Keenan run more of these slant/crossing routes. Although they’re short routes, they are highly successful and can create a lot of yards after the catch.
For Tyrell Williams, an unrestricted free-agent this offseason, and Travis Benjamin (who is rumored to be on the chopping block) these numbers don’t suggest their route trees were very effective in this 6 games stretch. Here’s to hoping the Chargers find new receivers to step up in their spots next season.