The NBA is finally returning this week after taking a break for over 4 months due to the coronavirus pandemic. One bit of drama to watch in the “Disney bubble” is the beef between TJ Warren and Jimmy Butler. Back in January, Butler called Warren “soft”, “trash”, and “not even in my f—— league”. The Pacers and Heat even have neighboring practice courts, so they are bound to clash often over the coming months.

In this post, I will be comparing Warren and Butler to determine if Jimmy’s comments hold water or if he’s just blowing smoke. Butler certainly is the bigger name and has far more accolades to boast: he’s a 5-time all-star, 4-time All-Defensive team, 2-time All-NBA player, and an Olympic gold-medalist. However, Warren is a rising star and is the Pacer’s top scoring threat.
In this post, I’ll be comparing the famous “Four Factors” for Butler and Warren’s offensive games:
- Shooting (Effective Field Goal Percentage, eFG%)
- Turnovers (TOV%)
- Rebounding (TRB%)
- Free Throws (FT/FGA)
Shooting
Let’s start by comparing their shooting. We’ll use effective field-goal percentage because this accounts for the different values of 2 and 3 point shots.
Warren has a career 53.8% eFG compared to Butler’s 49.0% - but is that a significant difference? We can look at this question a couple of ways:
-
Frequentist approach - 2-proportion Z-test:
2-sample test for equality of proportions with continuity correction

data:  c(warren_succ - 2136, butler_succ - 3442) out of c(warren_n - 4012, butler_n - 7030)
X-squared = 18.536, df = 1, p-value = 1.667e-05
alternative hypothesis: two.sided
95 percent confidence interval:
 0.02322830 0.06234542
sample estimates:
 prop 1    prop 2
 0.5324028 0.4896159
This approach shows a highly significant difference. T.J. has an eFG% that is likely between 2% and 6% greater than Butler’s.
-
Bayesian approach - comparing posterior distributions:
In the Bayesian approach, we will start with an open-minded view that Warren and Butler’s true eFG% could lie somewhere between 40% and 60% with equal probability of each value in between (this is called the “prior distribution”).
We then update this distribution based on the likelihood that we’d observe their career values of eFG%. The final result are 2 distributions that have almost no overlap, meaning that even if T.J.’s true eFG% was on the low-end of his possible values and Jimmy’s was on the high-end, we would still see T.J. as a more efficient scorer.
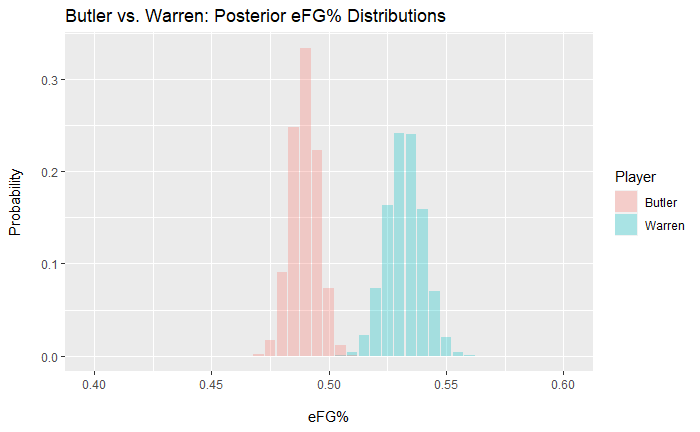
We’ll chalk this one up to Warren. This is not super surprising because T.J. is known to be a scorer while Jimmy is more of a defensive/all-around player. Let’s see if the other parts of Jimmy’s game make up for his shooting.
Turnovers
Now let’s look at their turnover rates. This can give a sense of their ball-handling and decision making skills on offense.
Warren has a career 7.0% turnover percentage compared to Jimmy’s 9.3%. I personally have a hard time interpretting TOV% because it’s hard to imagine how big the denominator is, since it’s an estimate of the number of possessions.
Using the Bayesian approach described above, we can create distributions of the most likely true TOV% for Warren and Butler. Again, there is hardly any overlap between the distributions, and we can safely assume Warren costs his team significantly less in terms of turnovers per game.
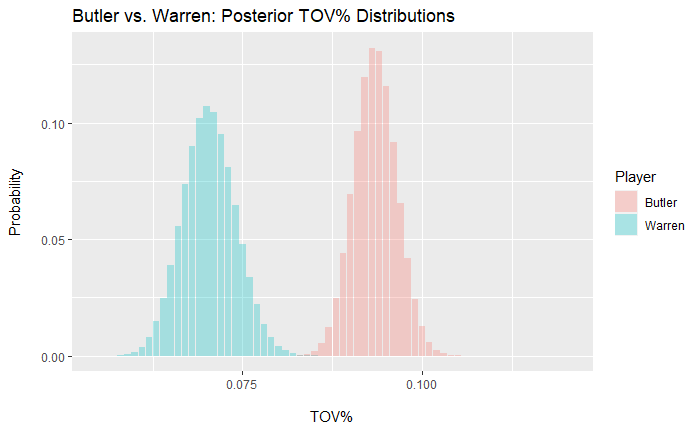
This is part of T.J.’s game that doesn’t get much credit - but he has spent 3 of the last 4 seasons in the top 10 in the league in TOV%.
We’ll chalk this one up to T.J. again. The score is 2-0, T.J., for all of those keeping score at home.
Rebounding
We will compare the total rebounding percentages as a sense of both offensive and defensive rebounding abilities.
The career rebounding percentage for “Jimmy G. Buckets” is 8.5% and Tony Buckets is sitting at 7.8%. At first glance, this doesn’t seem like a huge difference, but let’s see if it’s statistically significant.
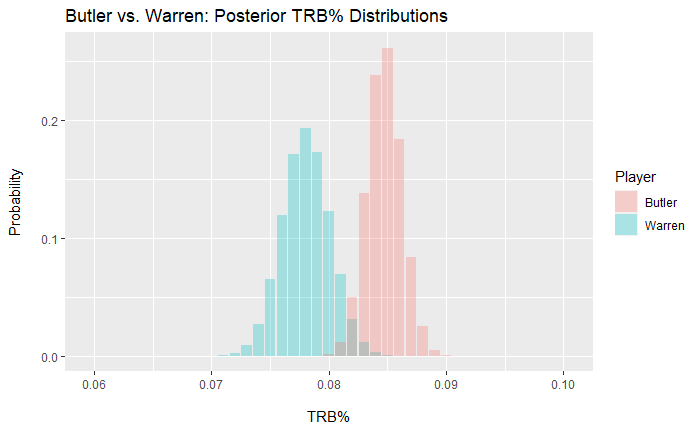
This is the closest call yet. However, the area of overlap is still less than 1 percent, and it’s a significant difference. It’s also worth mentioning that Jimmy’s rebounding has improved significantly this year, up to 10.9% in his first season with Miami.
Butler takes his first category with an advantage in the rebounding department. Score is now Warren: 2, Butler: 1.
Free Throws
Finally, we’ll use the ratio of free-throws made to field-goals attempted to compare both how often each player gets to the line and how often they make those those free-throws.
On average, Jimmy creates about 0.42 extra points from free-throws for every field goal attempted. Meanwhile, T.J. is sitting at a much lower 0.16. This is a significant margin by any test… it’s really not even close.
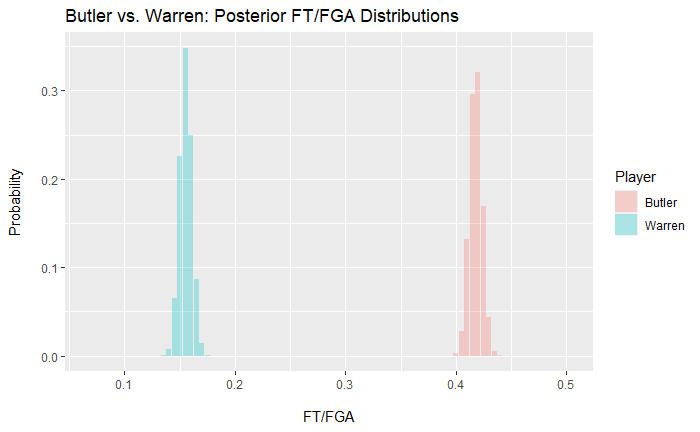
So Jimmy wins the closest race (rebounding) and also has the biggest blow-out here in the free throw category. This isn’t especially surprising: Butler attempts more than twice the number of FTs/game as Warren (6.1 to 2.5). Jimmy gets the last laugh by taking this category.
Final Tally
| Factor | Warren | Butler |
|---|---|---|
| Shooting | X | |
| Turnovers | X | |
| Rebounding | X | |
| Free Throws | X |
So there you have it, T.J. and Jimmy are dead even after comparing the 4 main offensive categories. Going back to Jimmy’s trash talk, I’d say they T.J. actually is “in his f—— league”.
I’ll admit, this analysis doesn’t cover everything. Butler is absolutely the better defender, but that isn’t so clear on the offensive end. They are very different players, each with unique strengths and weaknesses.
Looking forward, on August 10th the Pacers and Heat will play in one of the final games to determine playoff seeds. Jimmy has been talking trash and circled the Pacers game on his calendar so it’ll be fun to watch this match-up. Currently, the Heat are the 4th seed and the Pacers are 2 games back as the 5th seed in the Eastern Conference.
Update 10/6/2020:
While Warren had a hot start in the bubble through 3 games, it was Butler who really came out on top in this matchup. His Heat convincingly swept the Pacers in the first round of the playoffs and cruised to the NBA Finals. Jimmy just had a 40-point triple-double in Game 3 and looks to even the Finals series with the Lakers in Game 4 tonight.
Another thing worth mentioning in this update is that while Jimmy Butler is not a great long-range shooter, that does not mean he is a bad player. As this article points out, “the analytics community likes 3-pointers, but they love free throws”. Jimmy’s knack for getting to the free-throw line and creating great shots for his teammates is what makes him a great player.